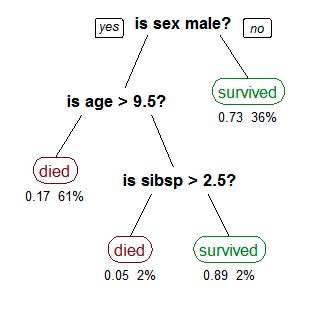
 Source: By Stephen Milborrow – Own work, CC BY-SA 3.0, https://commons.wikimedia.org /w/index.php?curid=14143467 “A tree showing survival of passengers on the Titanic (“sibsp” is the number of spouses or siblings aboard). The figures under the leaves show the probability of survival and the percentage of observations in the leaf. Summarizing: Your chances of survival were good if you were (i) a female or (ii) a male younger than 9.5 years with less than 2.5 siblings.” Tree based algorithms are supervised methods, meaning that we need labeled data to train the model, to figure out what decisions to make and in which order. Only after training can we use the model to make predictions on unlabeled data. Tree based algorithms can be used on both classification and regression problems. Classification problems are those where the variable we wish to predict has only a small number of discrete outcomes. For example in the image above, there are two outcomes: the person survived or not. Regression problems predict a continuous variable, for example, how much a customer will spend in an online shop. An important aspect of tree based algorithms is that they are easily interpretable. As you can see in the image, it’s quite simple to understand how the algorithm predicts what it predicts, what are the decisions it makes. In machine learning we often use algorithms that are practically “black boxes”: they seem to work well, give accurate predictions, but we cannot tell how those conclusions were reached. In business settings “black box” algorithms are often unacceptable no matter how good their scores are – which is understandable. If an algorithm refuses your mortgage application or predicts that you have a high chance to get a certain kind of disease, wouldn’t you want to know why it reached that conclusion? Of course, most problems are more complicated than the one in the above example and a simple decision tree is not sufficient to solve them. But ensemble methods provide enough flexibility to deal with very complex problems. Ensemble methods are constructed of several individually trained models, which are then combined. There are several such algorithms, let’s take a quick look at the most popular ones.
Random forest
Until a few years ago the Random Forest was considered as one of the most powerful machine learning algorithms. As you can guess from its name, a random forest model contains many decision trees. In order to train these trees, the algorithm samples the data randomly with replacement creating several subsamples and trains one tree on each of the subsamples. Then it combines the prediction of the trees, for example by using majority vote for a classification problem, and averaging the predictions for a regression problem.
Boosting
Boosting algorithms are newer and even more powerful tools than Random Forest. While Random Forest builds trees in parallel, boosting algorithms build the trees one after the other, taking into account the weakest points of the previous models, and creating a model that strengthens those points in the next step, converting weak learners into a strong one as a result. The two most popular methods both use gradient boosting. LightGBM was developed by Microsoft (https://github.com/microsoft/LightGBM), while XGBoost (https://github.com/dmlc/xgboost) was developed as an open source project. Both algorithms are fast, implement parallel processing, and can be used for a great variety of problems.
Interpreting ensemble methods
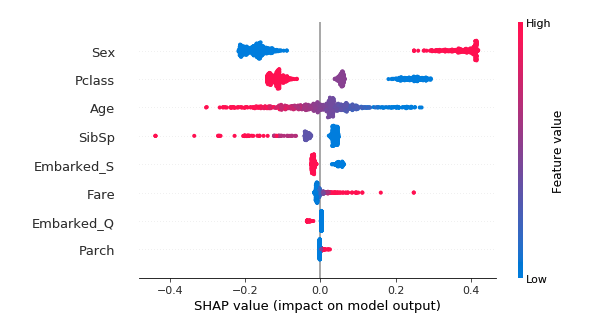
As mentioned above, a huge advantage of tree-based methods is their interpretability, that it’s possible to understand why the algorithm predicts what it predicts. All the algorithms we discussed in this post provide tools to examine the importance of each of the input features. There are also several external tools that help to interpret your model, such as xgboostExplainer for the R language (https://github.com/gameofdimension/xgboost_explainer) and LIME (https://github.com/marcotcr/lime) or SHAP (https://github.com/slundberg/shap) for Python. These tools can help you discover deeper connections between the features, and refine your models; you can even use them to create illustrations that help explain how your model works to non-experts. The image below shows a figure created with SHAP using a model for predicting the survival of passengers of the Titanic (https://meichenlu.com/2018-11-10-SHAP-explainable-machine-learning/). It shows that females, first and second class passengers, and children had the best chance of survival. 


 Cookies configuration